
Particle image velocimetry (PIV): How we measure the velocity field
This video shows a sequence of images acquired during a particle image velocimetry (PIV) measurement of a finite‑size sphere in a turbulent boundary layer. The flow is seeded with small tracer particles that closely follow the local fluid motion and scatter light from a thin laser sheet illuminating the measurement plane. A camera records images at known time intervals. To obtain the velocity field, the images are processed by dividing each frame into interrogation windows and performing a cross‑correlation analysis to estimate the most probable particle displacement within each window. Dividing this displacement by the corresponding time interval yields the local velocity vectors. Applying this procedure across the entire field of view produces an instantaneous, spatially resolved two‑dimensional velocity field in the illuminated plane. For more details on this work, see Tee and Longmire (2024).
2026-03-19 22:28:35
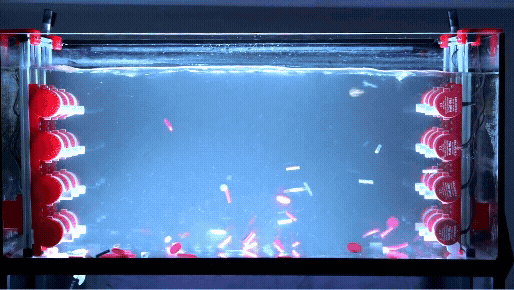
Dancing plastics in turbulence
This video shows how momentum from turbulence can move light particles such as plastic pieces around. The turbulence is created by two planes of randomly actuated water jets. Each plane is made of a four by four array of submersible bilge pumps placed on both sides of the glass tank. This experiment highlights the challenges in studying how turbulence controls the movement of plastic waste in the ocean, especially microplastics that contaminate our water and ecosystems. It also depicts why it is important to understand how particles interact with turbulence because this interaction affects their fate in the water. This demonstration has been showcased at several science fairs including Science is Wonderful! 2024 in Belgium and Trondheim Forskningstorget in Norway to help educate the public on the importance of protecting our environment from plastic waste. The turbulence tank, known as the T‑tank, was designed by Dr. Yi Hui Tee and Prof. R. Jason Hearst with funding from the European Union (MSCA-PF, InMyWaves,101107440; ERC StG, GLITR,101041000) and the Department of Energy and Process Engineering at NTNU. More details about the T‑tank facility can be found in Babiker et al. (2026).
2026-03-19 22:34:12
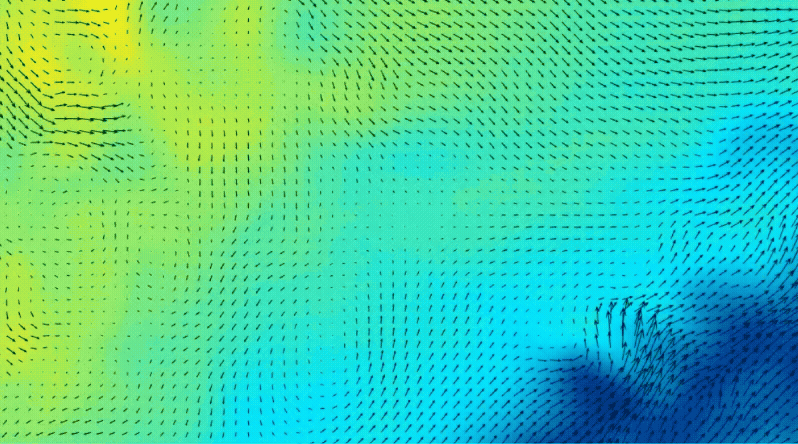
Visualizing turbulence: velocity vectors on a flow field
This movie shows the velocity field of turbulence in the T‑tank facility, obtained from stereoscopic particle image velocimetry measurements. The velocity vectors are overlaid on a contour map of the out‑of‑plane velocity component, providing a detailed view of the three‑dimensional flow structure. This visualization illustrates the turbulent flow conditions that drove the motion of the plastic particles seen in the related video “Dancing Plastics in Turbulence.”
2026-03-19 22:34:20
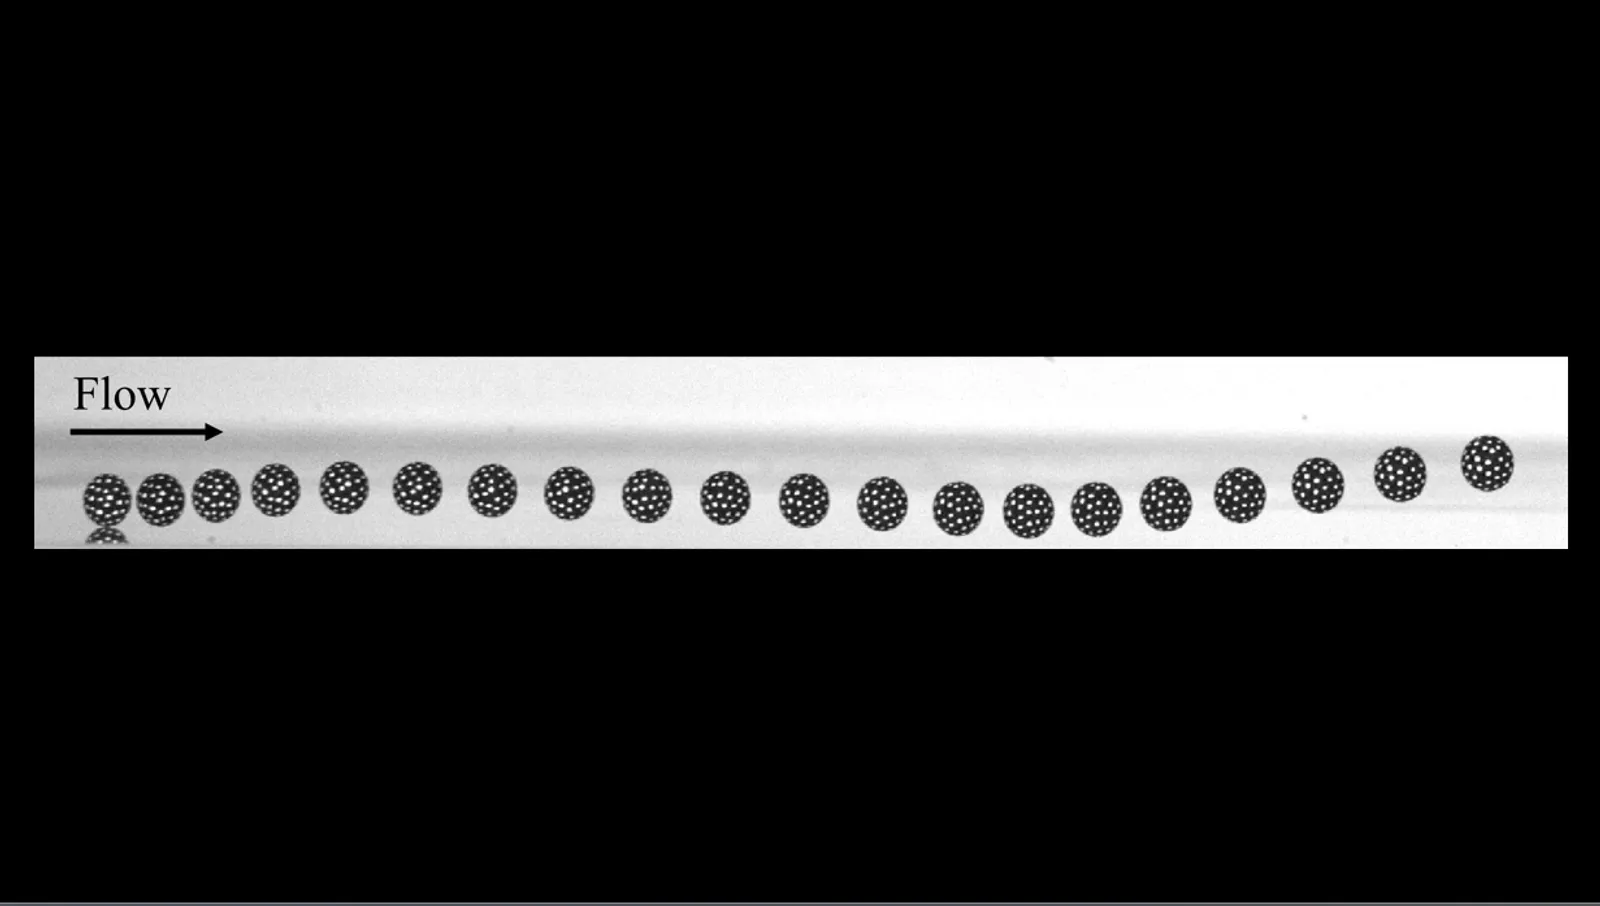
Spheres in turbulent boundary layer
This sphere tracking movie shows both spheres that were released from rest independently and allowed to travel with the incoming flow from the left in the recirculating water channel at the University of Minnesota. The objective of this work is to study how turbulence and wall friction affect the translation and rotation of a spherical particle in the near-wall region. The less dense sphere (top) experienced a stronger mean shear lift force upon release and immediately lifted off the wall. As it accelerated and propagated downstream, this sphere descended slightly before rising again. despite the decrease in mean shear lift. The subsequent lift-offs were driven by intermittent upward impulses from the surrounding turbulent flow. In contrast, the denser sphere (bottom) did not have sufficient lift to overcome its net downward buoyancy and therefore remained in contact with the wall. It initially slid downstream before gradually transitioning into forward rolling. Due to wall friction, its motion was more strongly impeded, causing it to lag the surrounding fluid more significantly. As it began to roll forward, this sphere occasionally exhibited small lift-off events due to Magnus lift force. This work was funded by the U.S. National Science Foundation (NSF CBET-1510154). For a detailed analysis of this work, see Tee, Barros, and Longmire (2020) and Tee and Longmire (2024).
2026-03-19 22:34:30
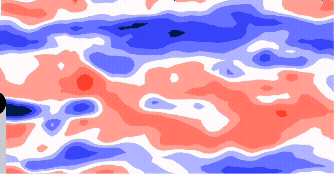
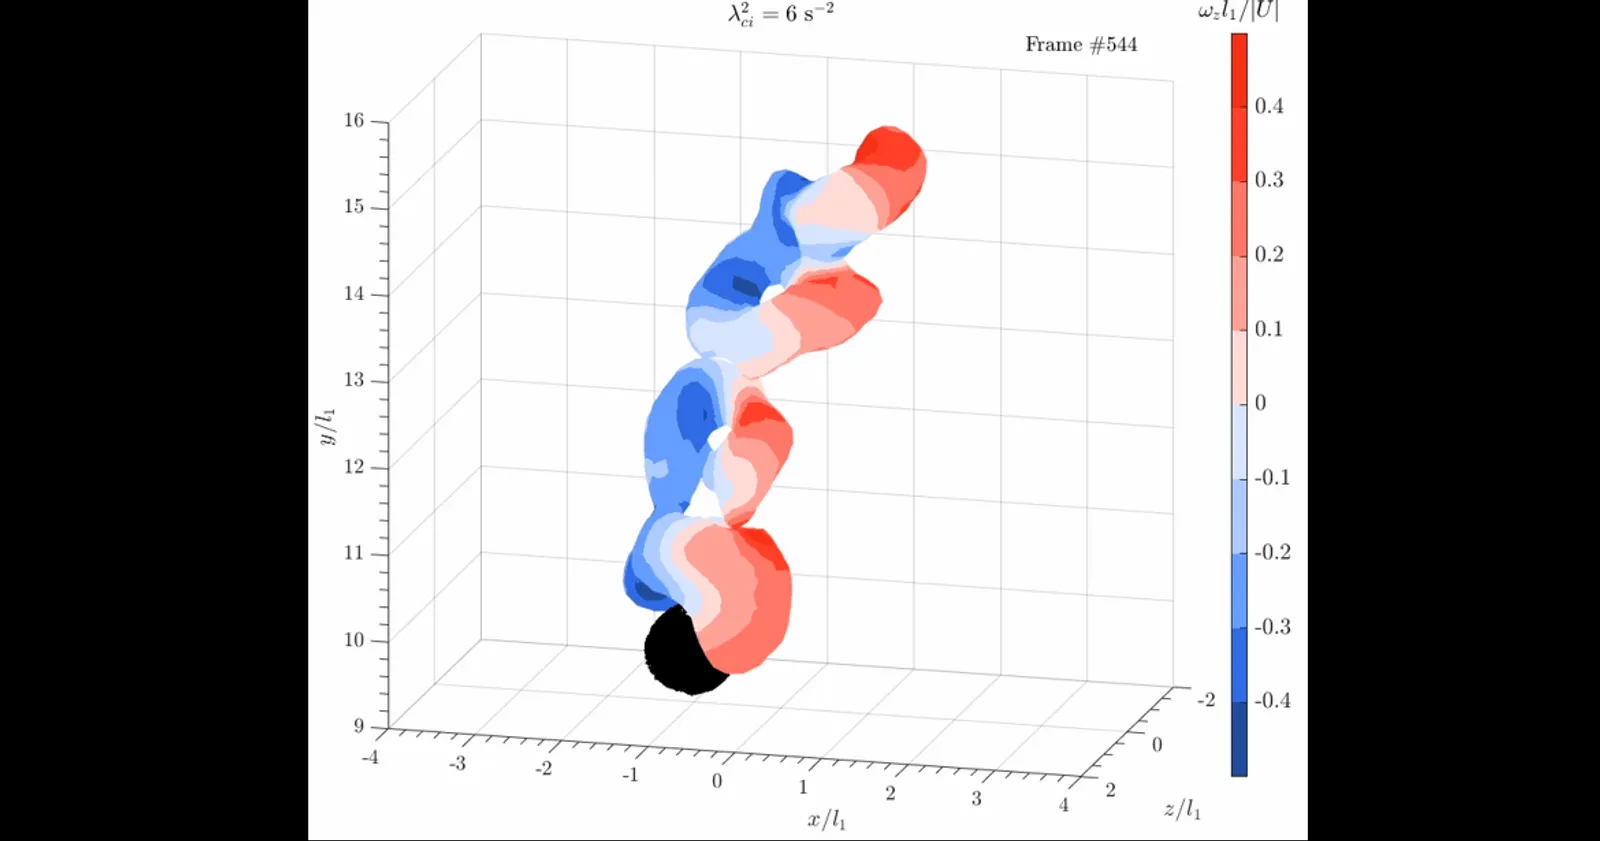
Competing magnus lift and drag in sphere spanwise motion
This supplementary movie 3 from Tee and Longmire (2024) illustrates how the denser sphere undergoes strong rotation about the wall normal (y) axis that alters its spanwise (z) motion. The objective of this work is to examine finite size effects of a spherical particle that are not represented in classical point mass particle models. As shown in the video, at streamwise x/δ≈1.6, the sphere enters a shear layer between slow- and fast-moving fluid and becomes surrounded by anticlockwise rotating vortical structures (green contours in the top left panel). These structures impart substantial torque, initiating rapid rotation about the y axis, as shown by the red θy curve in the top right panel. This induces Magnus side lift, which is a finite size effect, driving it toward -z (visible as increasingly negative Wp in the bottom right panel) even though it initially drifted toward +z. Near x/δ≈1.85, the sphere encounters a region of positive spanwise fluid velocity Wf≈0.12 U∞ as shown in the bottom left panel. The increased relative spanwise velocity amplifies spanwise drag, which temporarily overcomes the Magnus lift and reverses the sphere spanwise acceleration even though rotation remains strong. This movie demonstrates that finite size, torque driven dynamics play a critical role in determining the spanwise force balance. Such behaviors cannot be reproduced in classical point particle approaches, which assume no rotation, no shear induced torque, and no Magnus lift. By resolving the sphere full six degrees of freedom motion together with the surrounding flow, this work reveals mechanisms of particle transport that are neglected in simplified models and highlights the importance of accurate experimental measurement for finite size, inertia carrying particles in turbulent boundary layers. This research was supported by the United States National Science Foundation (NSF CBET 1510154). See Tee and Longmire (2024) and Tee, Barros and Longmire (2020) for detailed analysis.
2026-03-19 22:34:38
3D reconstructions of shed vortices of a sphere
This movie shows the isosurfaces of the instantaneous vortical structures visualized using the square of the swirling strength for a single sphere settling in a quiescent flow (left) and the same sphere when it falls into the turbulent wake of leading collective particles (right). (Because the videos were generated using different frame rates, the apparent falling speeds of the spheres in the movie cannot be directly compared and do not reflect their true settling velocities). The main objective of this work is to investigate the effects of bulk wake on the settling dynamics of the trailing particle. In the quiescent flow case (Rep=2640), the sphere sheds distinct hairpin like vortices downstream, with opposite signs of spanwise vorticity. In contrast, when the sphere descends into the wake of 20 leading particles (right), it encounters a chaotic field of vortices shed by the upstream bulk particles. They form a columnar structure of vortices with strong downward current, confirming the effects of downwash on the trailing sphere which increases its settling velocity. They also interact with the developing shear layer and disrupt the hairpin vortices shed from the trailing sphere, which become fragmented into smaller structures in the collective wake. This comparison underscores the importance of particle-wake interactions in shaping vortex topology (and the resulting descent dynamics for particle such as flat which flutters more violently from right to left in our example), highlighting how collective settling fundamentally alters both the forcing experienced by a trailing particle and the structure of its wake. For more details, see Tee, Dawson, and Hearst (2025), with supporting data available open access at DataverseNO.
2026-03-19 22:35:12
Linking free‑surface patterns to subsurface turbulence
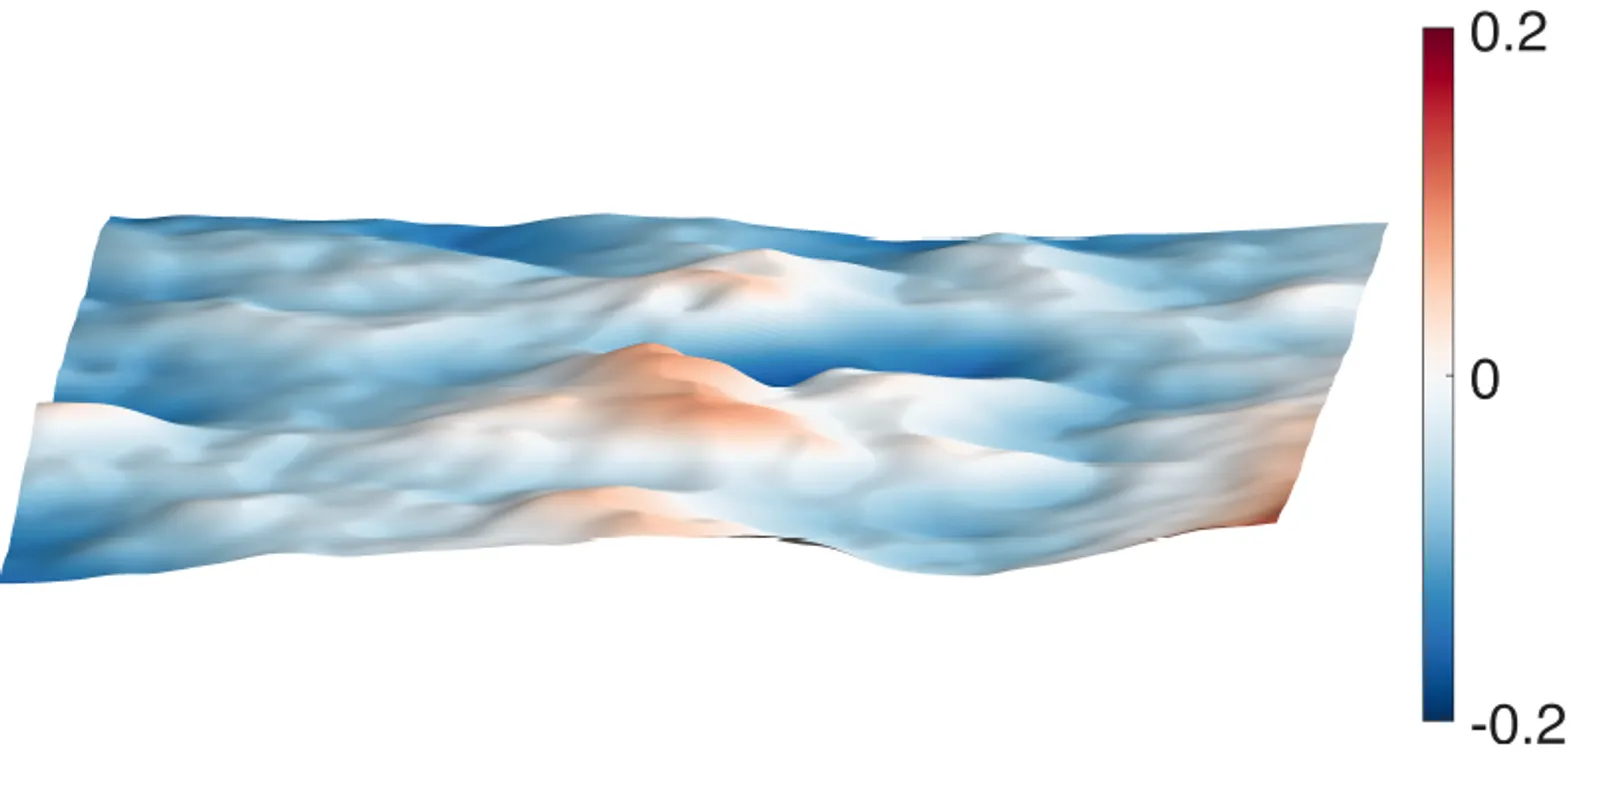
This movie shows the results from simultaneous measurements of the surface elevation and the subsurface velocity field in a jet stirred turbulence tank, the T tank in the horizontal plane. The main objective is to correlate free surface features with subsurface turbulence at higher Reynolds numbers. In this work, we focus on dimples, which are small circular imprints formed by vertical vortices attached to the surface, and scars, which are sharp, curved, elongated indentations left by horizontal vortices just beneath the surface. From left to right, the plots show the surface elevation obtained from profilometry measurements of the free surface, the horizontal divergence field 1 cm below the free surface (calculated from particle image velocimetry), and the identified surface structures obtained using a computer vision method based on two dimensional wavelet transformations. Our results show that, using only the information from the surface elevation, the estimated relative area of dimples and scars can be used as a proxy for changes in the mean square horizontal divergence below the free surface. This indicates that surface patterns contain meaningful quantitative information about the large, energy carrying turbulent eddies beneath the surface, making optical observations of the free surface a promising approach for remote sensing of subsurface flow. The video was generated by Omer M. Babiker from NTNU, Norway. The research was co-funded by the Research Council of Norway (iMOD, 673325114) and the European Union (ERC CoG, WaTurSheD, 101045299; ERC StG, GLITR, 101041000; MSCA-PF, InMyWaves, 101107440). For more details, see Babiker et al. (2026), with supporting data available open access at DataverseNO.
2026-03-19 22:35:19
Smoke wire flow visualization
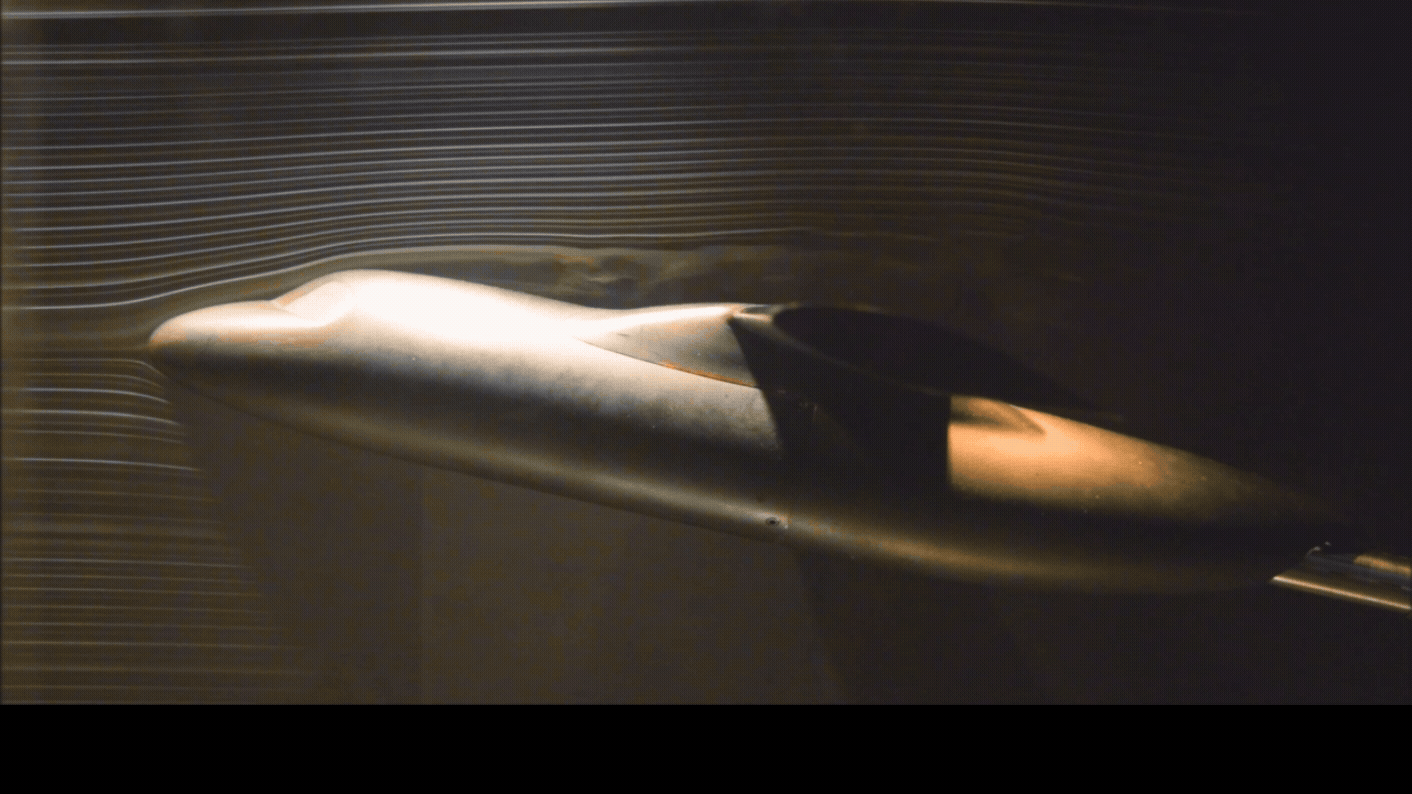
This video shows streaklines generated using a smoke‑wire flow‑visualization technique in the center plane of a model aircraft (wing body) tested in a recirculating wind tunnel. A double‑twisted Nichrome wire with a diameter of 0.18 mm and Safex oil were used to produce the smoke. At an angle of attack (AOA) of 0°, the flow remains largely attached over the fuselage and wing body, with separation observed downstream of the wing body. As the angle of attack is increased to 12°, the adverse pressure gradients strengthen and the boundary layer begins to separate earlier, indicating the onset and growth of three‑dimensional flow separation with increasing angle of attack. Due to the shadow cast by the aircraft body, which blocks illumination from above, the streaklines beneath the wing are poorly illuminated and therefore less clearly visible in the video.
2026-03-19 22:35:27